Understanding how neurons process information and interact with each other is very important for understanding how the brain processes information. Neuronal signals can be recorded with a multitude of devices. We are currently exploring neural data recorded via a multi-electrode array. A challenge of analyzing the recorded signal is how to identify single neurons. The existing spike sorting techniques have problems of inaccuracy and high computational cost. We have developed an algorithm to reliably identify propagation signals, which eminate from neurons, in each array. After identifying neurons, we can extract other statistics or properties of each neuron, and also infer neural connectivity. One application of our technique is that, with the neural path identified, we can compute the conduction velocity, which is an interesting property to look at when comparing mutated/wild type cultures or drugged/control cultures. Another application is that with the spike times of each neuron extracted, short latency connections can be identified between neurons, and connectivity networks can be constructed. With the network information, for each post-synaptic neuron, by analyzing the patterns of the pre-synaptic firing, we might be able to better understand the synaptic integration at each neuron.
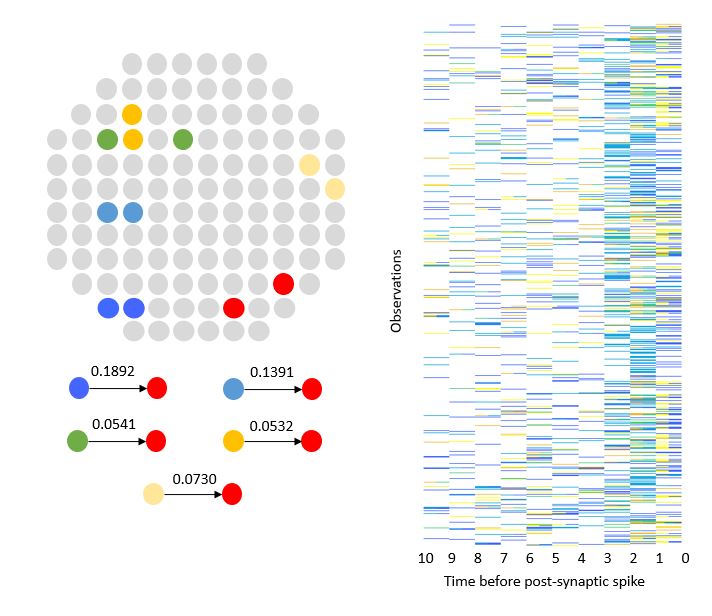
Figure on the left: The upper plot is the location of the signals. The two electrodes of the same color are the two anchor points for each signal. Each color represents a single neuron. The red signal is the post-synaptic signal, while all of the others are the pre-synaptic signal. The values on the line are the efficiency, calculated by (amount of spikes in CCG(0.5-10ms window))/(number of spikes in pre synaptic signal).
Figure on the right: There are 1207 observations (1207 post synaptic spikes). For each post-synaptic spike, we looked at 10ms prior to the spike and recorded the pre-synaptic signal's activity. The 10ms in the plot is binned into 10 bins, each bin representing 1ms. Each row in the plot shows whether one signal has spikes presenting in a bin or not. Each column in the figure represents one bin, and from left to right is from the farthest to the nearest of the post-synaptic spike. The events in the right-most column occurred just before the post-synaptic spike.